The AI J-Curve: Why Your Investment Will Lose Money Before It Scales
The AI J-Curve: Why Your Investment Will Lose Money Before It Scales
May 10, 2026
The most predictable moment of failure in enterprise AI transformation is Month 12. Not because the technology has failed. Not because the use case was wrong. Because the board was not prepared for the investment pattern -- and redirected funding at the exact moment the programme was on track to deliver value.
This is the AI J-curve problem. And unlike most enterprise AI challenges, it is almost entirely preventable -- if you have the right conversation before the investment begins.
Section 1- What the J-Curve Actually Is
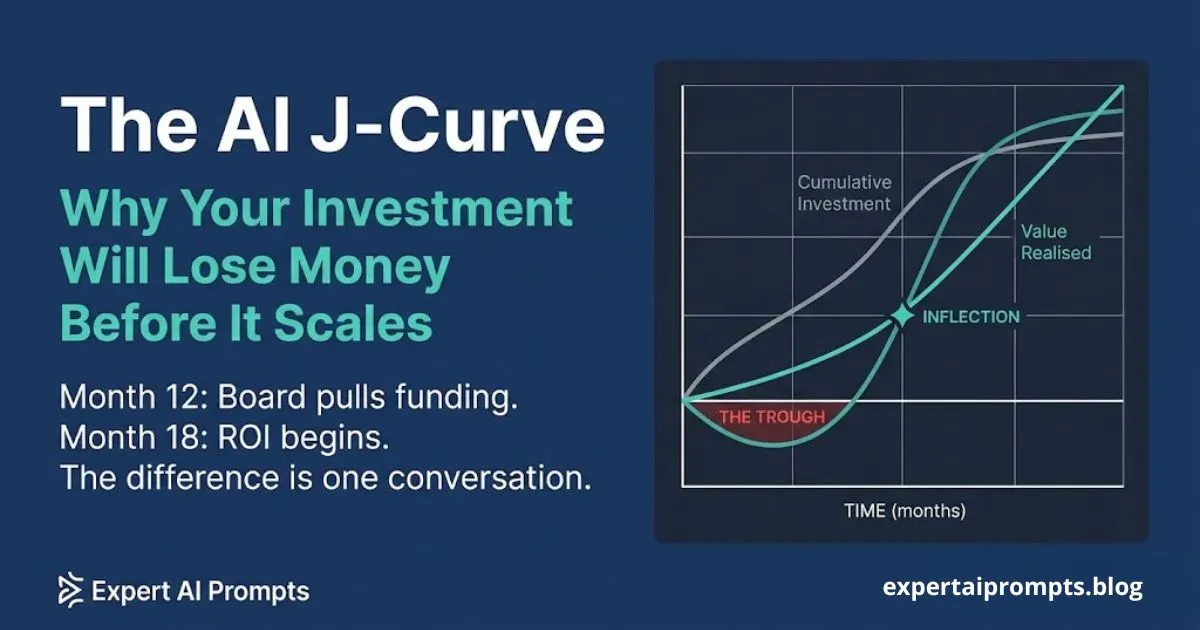
The J-curve is the defining financial pattern of every infrastructure investment. Enterprise AI transformation is an infrastructure investment. Understanding this distinction is the most important framing decision a CAIO or AI Strategy Leader makes at programme inception.
When a business invests in a new manufacturing facility, a cloud migration, or an ERP rollout, the investment curve precedes the return curve by months or years. Nobody expects a manufacturing plant to generate revenue before it is built. Nobody expects ERP to deliver productivity before it is implemented. Yet enterprise AI programmes are consistently evaluated against an implicit expectation that investment and return should coincide -- or that return should appear within a quarter of investment beginning.
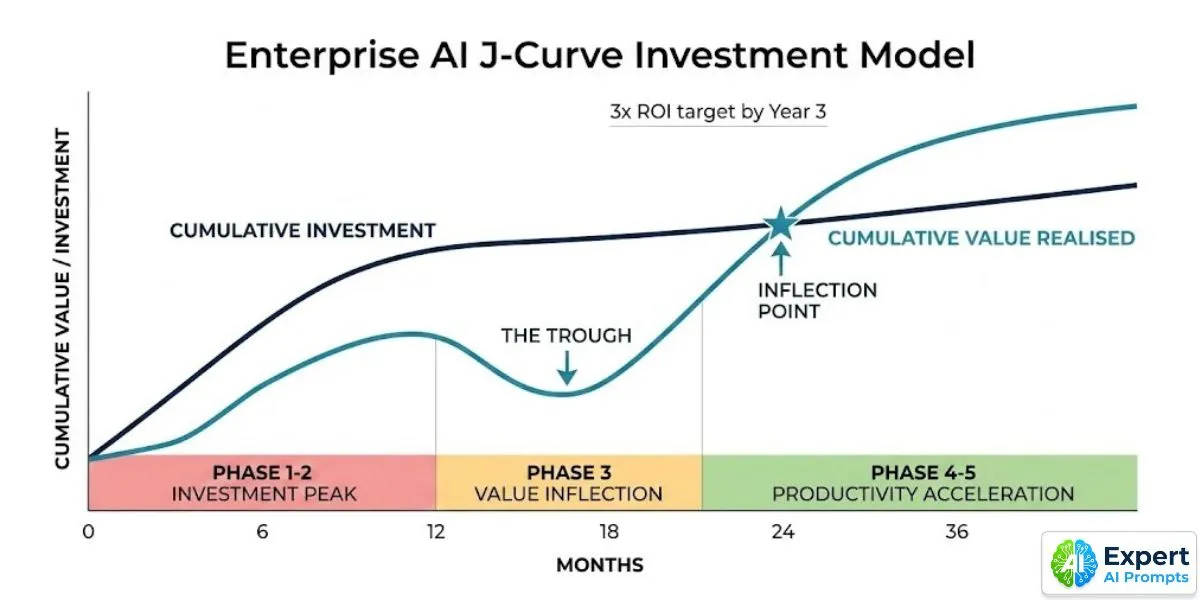
The J-curve describes the actual investment trajectory. In the first 12 months, costs are front-loaded: AI Centre of Excellence establishment, data remediation, governance infrastructure, tooling architecture, and the Phase 1-2 programme costs that build the shared foundations every subsequent use case inherits. The cumulative value realised curve starts near zero and rises slowly from the first production deployments. For a period -- typically Months 8 to 14 -- cumulative investment exceeds cumulative value realised. This is the trough.
The trough is not a sign of failure. It is the expected and correct pattern for infrastructure investment. But it looks like failure to a board that was not prepared for it.
The Enterprise AI Transformation Playbook The full five-phase framework is covered in The Enterprise AI Transformation Playbook.
Section 2 - Why Boards Pull Funding at Month 12 -- and Why It Kills Programmes That Were On Track
The Month 12 crisis follows a consistent pattern across organisations. The AI programme was approved with a business case citing productivity improvements, cost reductions, and competitive advantage. The board was shown a timeline in which investment preceded return by some reasonable-sounding period.
At Month 12, the board receives an update. The investment is real and significant. The production deployments are limited -- the programme is in Phase 2 governance build or early Phase 3 pilot. The cumulative value realised is a fraction of the cumulative investment. To a board that was not explicitly shown the J-curve at programme inception, this looks exactly like a programme that is failing.
They ask the questions that a board is supposed to ask: 'We have invested significantly for 12 months. Where is the return? Are we confident this programme will deliver?' The CAIO explains that the programme is on track, that the infrastructure investment is the correct use of Year 1 capital, that production deployments are imminent. But the explanation arrives without the pre-agreed framework that makes it credible. It sounds like justification, not reporting.
Funding is redirected. Or the programme is restructured -- which means restarting governance processes. Or the CAIO is replaced. The programme that was on the correct trajectory is now genuinely in trouble.
The Anatomy of the Month 12 Crisis
The Month 12 crisis has four structural causes that compound each other:
• The J-curve was not presented at programme inception -- the board approved investment without understanding its expected trajectory
• The Board Value Report was not committed to at programme inception -- there is no agreed milestone document that the board expects to receive
• Investment was reported in isolation from infrastructure progress -- the board sees cost without the governance and CoE progress that the cost is buying
• The first production deployment has not yet delivered a measurable ROI figure in dollars -- because success criteria were not defined before the pilot began
Escaping Pilot Purgatory The connection between pilot purgatory and the J-curve is direct -- use case selection and success criteria design are covered in Escaping Pilot Purgatory.
Section 3 - The Three J-Curve Phases: What Is Actually Happening at Each Stage
The J-curve has three phases. Each phase has a predictable investment pattern, a specific explanation of what the investment is actually producing, and a defined board communication approach. All three must be agreed with the board before the programme begins.
Phase 1 -- Investment Peak (Months 1 to 12)
Investment pattern: High and front-loaded. Cumulative investment rises steeply. Cumulative value realised rises slowly from early Phase 3 deployments. Investment exceeds value -- this is the trough period.
What is actually happening: The organisation is building the shared foundations that every subsequent use case will inherit at zero marginal infrastructure cost. Every dollar spent on CoE establishment, data remediation, and governance infrastructure in Phase 1 reduces the deployment cost of every use case in Phases 3, 4, and 5. Phase 1-2 investment is not overhead -- it is the risk reduction and infrastructure investment that makes the productivity acceleration in Phase 3 possible.
Board communication: Present the J-curve diagram at programme inception with 'You Are Here' positioned at Month 0. Commit explicitly to a Board Value Report at Month 9. Set the infrastructure milestones that justify the investment -- governance framework published, AI Governance Committee established, first use case Success Contract signed. Report against these milestones monthly, not against ROI that does not yet exist.
Phase 2 -- Value Inflection (Months 12 to 18)
Investment pattern: Wave 1 ROI begins. Foundation costs tail off as infrastructure build completes. The cumulative value curve intersects and begins to exceed the cumulative investment curve. The programme has crossed from net investment to net return.
What is actually happening: The first production deployments are generating real, measurable business value. Wave 2 use cases are deploying on the shared foundations built in Phase 1-2 -- at dramatically lower marginal cost than the Wave 1 deployments. The shared data pipelines, governance pre-clearance, and approved tool register reduce the Wave 2 deployment timeline from six months to under 30 days. The compounding returns are beginning.
Board communication: Deliver the Board Value Report with production actuals. Show the J-curve with 'You Are Here' positioned at the inflection point -- confirming the programme is on the trajectory that was agreed at inception. Report production count, cumulative value realised in dollars, and the Wave 2 investment case built on demonstrated Phase 3 ROI rather than projections.
Phase 3 -- Productivity Acceleration (Months 18 to 36)
Investment pattern: Compounding ROI from multiple production deployments. Marginal cost of new use cases declines rapidly as shared foundations mature. The gap between cumulative value and cumulative investment grows. The 3x investment return target is achievable by end of Year 3.
What is actually happening: The organisation is 'learning to fish' -- AI capability is becoming an organisational competency, not a programme. The shared foundations have compounded to the point where new use cases deploy in under 21 days. The AI Adoption Rate is approaching the 60-80% of eligible workforce target. The workforce is operating at 4x speed with quality on AI-augmented tasks. The competitive moat is forming.
Board communication: Quarterly AI Governance Dashboard showing compounding value. Year 3 ROI benchmark: 3x investment return. Funding approval for the Year 4-6 roadmap presented with the demonstrated ROI trajectory as evidence.
Section 4 - The Investment Benchmarks: What Enterprise AI Actually Costs
Every enterprise AI programme encounters a version of the same uncomfortable discovery: the actual cost of transformation is significantly higher than the vendor business cases suggested. This is not because vendors are dishonest -- it is because the cost categories that vendor slides omit are real and unavoidable.
The following benchmarks, drawn from industry research and programme data, represent the actual investment profile for enterprise AI transformation at meaningful scale:
Phase 1-2 investment allocation: Typically 10-15% of the total programme budget on strategy, assessment, governance, and infrastructure -- before any AI deployment. This is not overhead. It is risk reduction. Organisations that skip Phase 1-2 to accelerate to deployment typically spend 3 to 5 times the saving in Phase 3 remediation costs.
Total programme budget benchmark: Technology-forward industries allocate 3-4% of revenue annually for mature AI operations. Retail benchmarks average 3.32% of revenue. Organisations investing significantly less for the same transformation scope are underfunding either the technology layer or the people-and-process layer -- which BCG's 10-20-70 principle identifies as 70% of what determines success.
Annual cost run-rate by phase: Phase 1 approximately $400K-$600K. Phase 2 approximately $1.0M-$1.5M. Phase 3 approximately $1.4M-$2.0M. Phase 4 approximately $2.0M-$2.8M. Phase 5 approximately $2.1M-$2.9M. Governance infrastructure adds a 40% budget premium year-over-year as regulatory obligations mature -- plan for this growth in Year 2 and Year 3 budgets.
3-year ROI target: 3x investment return by end of Year 3. Research validates this benchmark across multiple sectors -- a single developer productivity use case modelled by CIO Magazine produced $2.4M return over five years on $35/hour savings across a fraction of developer tasks. The 3x target by Year 3 assumes 3-5 production deployments with validated ROI, a functioning CoE with shared foundations, and a Wave 2 pipeline deploying at sub-30-day speed-to-production.
Enterprise AI Readiness Checklist Before committing programme budget, the Enterprise AI Readiness Checklist will show exactly which readiness gaps your Phase 1 investment needs to address.
Section 5 - How to Present the J-Curve Before It Happens
The J-curve conversation must happen before the first dollar of transformation investment is committed. A board that discovers the J-curve at Month 12 -- when the cost is real and the return is not yet visible -- interprets the presentation as excuse-making. A board that was shown the J-curve at programme inception and committed to the trajectory recognises Month 12 as the expected pattern.
The difference between these two conversations is not the content. It is the timing. The exact same J-curve diagram, presented at Month 12, looks like a justification. Presented at programme inception and revisited quarterly, it looks like programme management.
The Four J-Curve Commitments to Make at Programme Inception
When presenting the J-curve to the board at programme inception, secure four explicit commitments before the programme begins:
1. The board has seen the J-curve diagram and understands that cumulative investment will exceed cumulative value realised for a defined period -- and that this is the expected pattern for infrastructure investment, not a programme failure signal.
2. The board has agreed to specific infrastructure milestones that justify Phase 1-2 investment independently of ROI: governance framework published and live, AI Governance Committee established, first use case Success Contract signed and in production sprint by Month 6.
3. The board has committed to receiving the Board Value Report at Month 9 -- a specific document format agreed in advance, containing production count, value realised in dollars, compliance status, and the J-curve with 'You Are Here' marked.
4. The board has agreed that investment decisions between now and Month 9 will be evaluated against infrastructure progress milestones, not against ROI figures that are not yet available.
Enterprise AI Transformation Roadmap 2026 The 90-day onboarding framework covers the Day 30 State of AI Report and the board briefing sequence in detail.
AI Governance Framework Template The AI Governance Framework Template contains the governance infrastructure milestones your board needs to see at the Month 9 Board Value Report.
Section 6 - The Board Value Report: What to Deliver at Month 9
The Board Value Report is the single document that closes the gap between the J-curve commitment made at programme inception and the board's confidence at Month 12. It is delivered at Month 9 -- before the trough arrives, not during it -- and it gives the board the data they need to remain committed through the investment peak.
The Board Value Report is a maximum five-page document. It does not contain projections, forecasts, or strategic aspirations. It contains production actuals. If there are no production actuals at Month 9, the programme has missed its Phase 3 gate and the conversation with the board is different -- but it is still better to have that conversation at Month 9 than to explain the absence of data at Month 12.
The Five Elements of a Credible Board Value Report
1. Production count: The number of AI use cases running in production with governance controls active and a named accountable owner. Not pilots. Not demos. Not projects in sprint. Production systems delivering measurable value to real users.
2. Value realised in dollars: Cumulative business value captured as cash actuals -- cost savings realised, revenue lift demonstrated, risk reduction quantified. Not annualised projections. Not forecast run-rates. Actuals only. This is the number the board is actually asking about.
3. J-curve position: A reproduction of the J-curve diagram shown at programme inception, updated with actual investment and actual value realised plotted against the projected curves. 'You Are Here' marker. Is the programme on trajectory? If not, why, and what is the remediation plan?
4. Compliance and governance status: EU AI Act compliance programme status (2 August 2026 full enforcement deadline). AU Privacy Act readiness. SOC 2 controls. Named owner for each outstanding item and resolution date.
5. Investment proposal for Wave 2: A specific dollar ask for the next wave, built on the demonstrated Phase 3 ROI rather than projections. The board is being asked to fund Wave 2 on evidence, not faith.
The ARIA model structures every board AI communication across the full programme life: Accountability (what was committed, what was delivered), ROI Evidence (production actuals), Investment (specific ask), Action Required (named board decision). Any board communication that does not include all four elements is incomplete.
Section 7 - The Hidden Costs That Vendor Slides Always Omit
Every enterprise AI programme encounters a version of the same conversation between Month 3 and Month 6: 'These costs weren't in the business case.' This is not fraud. It is a systematic blind spot in how AI vendors present ROI, which focuses entirely on the value the technology produces and omits the organisational costs required to produce it.
The hidden cost categories that appear consistently across enterprise AI programmes:
Data quality remediation: Budget $12.9 million annually per large enterprise as a baseline data governance cost. This is the cost of maintaining AI-ready data -- cleaning, validating, lineage documentation, and pipeline maintenance. It is real operational expenditure that vendor ROI presentations consistently model as zero. Every AI use case that discovers data quality problems in production has encountered a cost that should have been budgeted in Phase 1.
Governance infrastructure: EU AI Act compliance costs for high-risk AI systems include Annex IV technical documentation packages, human oversight design, bias testing, and EU AI database registration. Governance infrastructure costs add approximately 40% budget premium year-over-year as regulatory obligations mature. The 2 August 2026 enforcement deadline is not optional.
Change management and workforce uplift: BCG's 10-20-70 principle: 70% of AI transformation outcomes are determined by people, processes, and culture. Yet change management is the budget line most frequently reduced when AI programmes need to find savings. The ADKAR-based workforce transformation programme, the Champion Network development, and the three-tier AI skills certification programme are not discretionary. They are the 70%.
Integration engineering: Integration with legacy systems is consistently listed as the number one root cause of AI scaling failure (Section 3 of Escaping Pilot Purgatory). The cost of integrating AI outputs into existing operational systems -- ERP, CRM, core banking, clinical systems -- is rarely included in AI vendor ROI models. It is one of the largest cost categories in Phase 3 production deployment.
Monitoring and drift management: An AI system without drift detection, accuracy monitoring, and alerting is not a production system. It is a sandbox with real users. The cost of operational monitoring infrastructure -- model drift detection, performance dashboards, accuracy trend analysis, incident response tooling -- is not included in most AI platform licensing costs. It is a separate, ongoing operational cost.
Enterprise AI Governance Framework The complete compliance cost picture and governance architecture is covered in the Enterprise AI Governance Framework.
Closing - Preparing Your Board for the J-Curve
The J-curve is not a problem you manage. It is a conversation you have before the programme begins. Every organisation that loses board confidence at Month 12 either did not have that conversation or had it too late.
The organisations that successfully navigate the investment trough share three characteristics: they showed their board the J-curve diagram at programme inception and secured explicit commitment to the trajectory; they delivered the Board Value Report at Month 9 with production actuals -- not projections; and they built the AI Centre of Excellence as the shared foundation that makes the Phase 3 value inflection possible within the original timeline.
If your programme is already in the trough and the board conversation is overdue, have it now. A board that discovers the J-curve during the trough -- when it is accompanied by a Board Value Report showing governance progress, infrastructure milestones achieved, and the first production ROI actuals -- can still be converted to informed supporters. The conversation is harder than it would have been at inception. It is still possible.
Your next steps:
The Enterprise AI Transformation Playbook
The full five-phase framework, including the J-curve investment model and the ARIA board communication structure.
The organisational infrastructure that builds the shared foundations the J-curve trough is paying for.
Why use case selection and success criteria are what make the value inflection arrive on time.
About the Author
Matthew Bulat is the Founder of Expert AI Prompts and a 20+ year technology and AI strategy executive. Former CTO, Federal Government Technical Operations Manager for national infrastructure across 20 cities and 4,000 users, and 8+ year University Lecturer at CQUniversity. The J-curve framework in this article is drawn from the Enterprise AI Transformation Playbook -- the same investment model applied in the Expert AI Prompts live platform: 30 industries, 1,500+ prompts, 15 AI workflow systems, near-zero daily operations.