Building a Business Dashboard with AI Insights
Building a Business Dashboard with AI Insights
Jan 28, 2026

If you are like most small business owners, your business data is currently living in five different places. You have sales figures in your payment processor, customer details in a CRM (or a spreadsheet you haven't opened in weeks), website traffic in Google Analytics, and a mental list of "to-dos" that keeps you awake at 2:00 AM.
You don’t lack information. You lack clarity.
For entrepreneurs like Alex Rivers—wearing every hat from CEO to cleaner—the challenge isn't gathering data; it is making sense of it quickly enough to make a decision. You want to scale, but you are stuck in the weeds of daily operations. You know the big players have dedicated data analysts and expensive software suites, but you need a solution that fits a lean team and a tight budget.
This is where ai business tools have leveled the playing field.
You no longer need a degree in data science or an enterprise budget to build a command center that tells you exactly how your business is performing. By building a business dashboard powered by AI insights, you can transform that overwhelming mountain of numbers into a clear, navigable roadmap. This guide will walk you through the practical steps to build a system that works as hard as you do—allowing you to stop hustling blindly and start scaling strategically.
Why Your Business Needs an AI Command Center
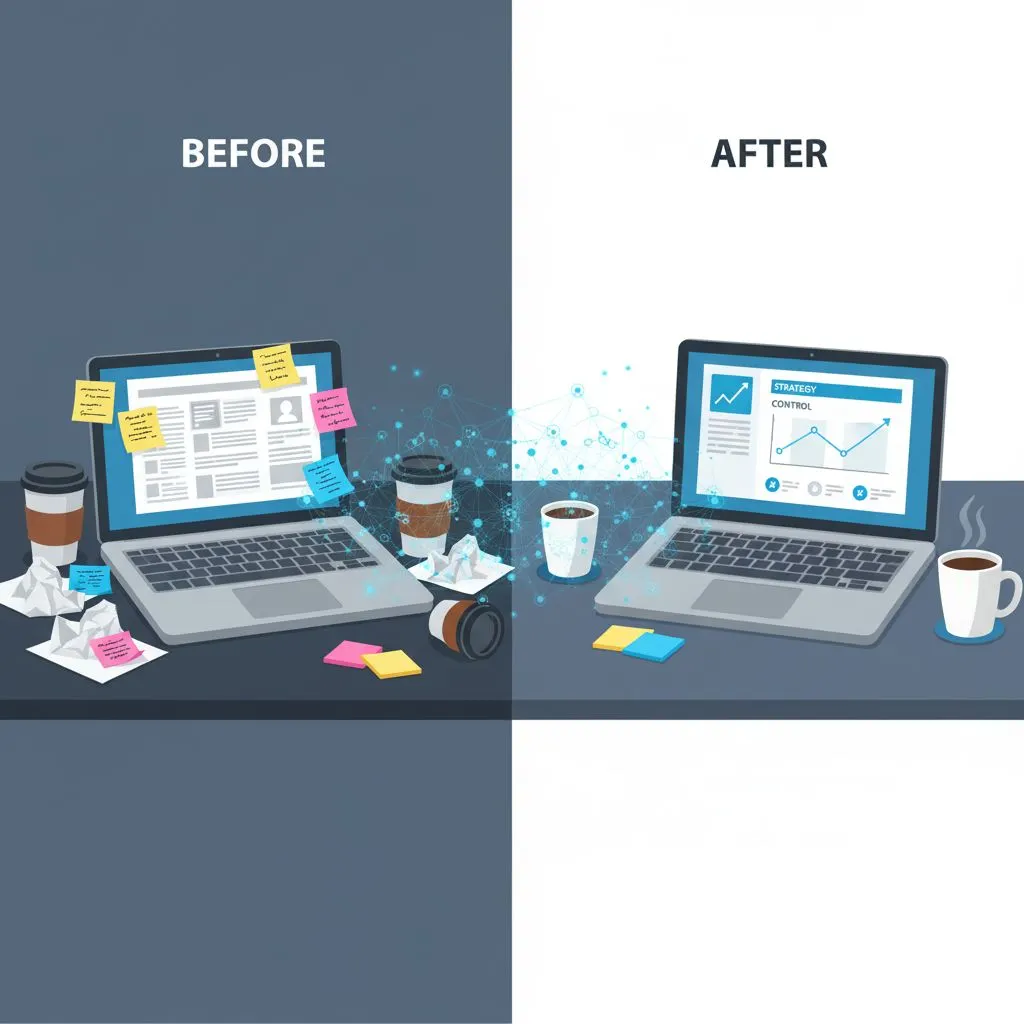
We often confuse "being busy" with "being effective." You might spend ten hours a day answering emails and fulfilling orders, feeling productive, yet your bank account doesn't reflect the effort. This is usually because of a disconnect between activity and strategy.
A dashboard acts as your business's instrument panel. Imagine trying to fly a plane in cloudy weather without an altimeter or a fuel gauge. That is what running a business without a dashboard feels like—stressful, reactive, and dangerous.
Clarifying the Chaos
The primary enemy of the modern entrepreneur is cognitive load. When you have to manually check five different logins to see how much money you made yesterday or where your leads came from, you are wasting mental energy that should be used for creative problem-solving. A centralized dashboard brings the truth to one screen. It reduces the "noise" and allows you to focus on the "signal."
Beyond Vanity Metrics
It is easy to get distracted by numbers that look good but don't pay the bills—like Instagram likes or website hits. An AI-enhanced dashboard helps you drill down into what actually matters: Customer Acquisition Cost (CAC), Lifetime Value (LTV), and Net Profit. AI doesn't just display these numbers; it can help you understand the relationship between them. For example, it might reveal that while your website traffic is up, your conversion rate has dropped because of a slow checkout page.
For a curated list of tools that track what matters, see our guide to 5 AI business tools to reclaim your week.
Speed to Insight
This is the true game-changer. Traditionally, analyzing monthly reports meant exporting CSV files, wrestling with Excel formulas, and creating pivot tables. By the time you finished, the data was two weeks old.
With modern ai business tools, you can feed raw data into an AI model and ask plain English questions like, "Which service had the highest profit margin last month?" or "Based on current trends, will we hit our Q3 targets?" The AI acts as your on-demand Chief Financial Officer, providing answers in seconds rather than hours. This speed allows you to pivot your strategy in real-time, correcting course before a small issue becomes a revenue-killing problem.
Want to see what that looks like in practice? Download 5 AI prompts that save you 5 hours this week — free.
The "Low-Code" Stack: Essential Tools for the DIY Entrepreneur
One of the biggest objections small business owners have regarding data dashboards is the perceived complexity. "I’m not a coder," or "I can’t afford a $2,000/month subscription" are common refrains. The good news is that the modern tech stack for building a robust dashboard is surprisingly accessible, affordable, and requires little to no coding knowledge.
To build your AI-powered command center, you need four specific components: a central hub, an analyst, a visualizer, and a connector.
1. The Central Hub: Google Sheets or Airtable
Start simple. You don't need a complex SQL database. Google Sheets is incredibly powerful, free, and integrates with almost everything. For those who want a bit more structure and database-like features, Airtable is a fantastic upgrade.
- Why use it: It serves as the "staging ground" where all your data lands before it gets visualized.
- Cost: Free to low cost.
2. The Analyst: ChatGPT Plus, Claude, or Gemini
This is the brain of your operation. These Large Language Models (LLMs) are the ai business tools that will interpret your data. Instead of writing complex formulas, you will paste data (or upload files) into these tools to clean, sort, and analyze it.
- Why use it: To spot patterns, generate summaries, and clean messy data instantly.
- Cost: $20/month for premium versions (highly recommended for data privacy and file upload limits).
Not sure which LLM is right for your workflow? Compare the best AI assistants for entrepreneurs in our 2025 review.
3. The Visualizer: Looker Studio
Formerly Google Data Studio, Looker Studio connects natively to Google Sheets. It allows you to drag and drop charts, scorecards, and graphs onto a canvas. It turns your boring spreadsheet rows into professional, real-time gauges.
- Why use it: It’s free, customizable, and shareable with your team or stakeholders.
- Cost: Free.
4. The Connector: Zapier or Make
If you want to automate the process so you aren't manually copying and pasting data every day, you need a connector. These tools "listen" for triggers (like a new sale in Shopify) and perform an action (add a row to Google Sheets).
- Why use it: To reclaim your time and ensure your dashboard is always up to date.
- Cost: Free tiers available; scales with usage.
Step-by-Step: Building Your Dashboard
Now that we have our toolkit, let’s look at the workflow. We are going to move from "data scattered everywhere" to "centralized insight."
Step 1: Data Consolidation
First, identify the 3-5 metrics that actually drive your business. Don't try to track everything immediately. For Alex Rivers, a typical service-based entrepreneur, these might be:
- Revenue: (Stripe/PayPal/Invoices)
- Leads: (Contact form submissions/Email signups)
- Active Projects: (Project management tool status)
- Cash Flow: (Bank balance vs. outgoing expenses)
Create a Google Sheet with separate tabs for each of these categories. If you are doing this manually to start (which is fine!), schedule 15 minutes every Friday to export your data from your sources and paste it into these tabs.
Step 2: Data Cleaning with AI
Raw data is often messy. Dates might be formatted differently, or customer names might have weird capitalization. This is where AI saves you hours.
- Action: Download your raw CSV from your sales tool.
- Prompt: Upload the file to ChatGPT (or your preferred AI) and use a prompt like: "I have attached a CSV of my sales data. Please clean this data by standardizing the date format to DD/MM/YYYY, removing any duplicate entries, and separating the 'Customer Name' column into 'First Name' and 'Last Name'. Provide the cleaned data as a downloadable CSV."
This turns a headache-inducing spreadsheet cleanup into a 30-second task.
Want a reliable structure for every prompt you write? Download the free Perfect Prompt Framework — a one-page guide to expert-level AI outputs.
Step 3: The Integration
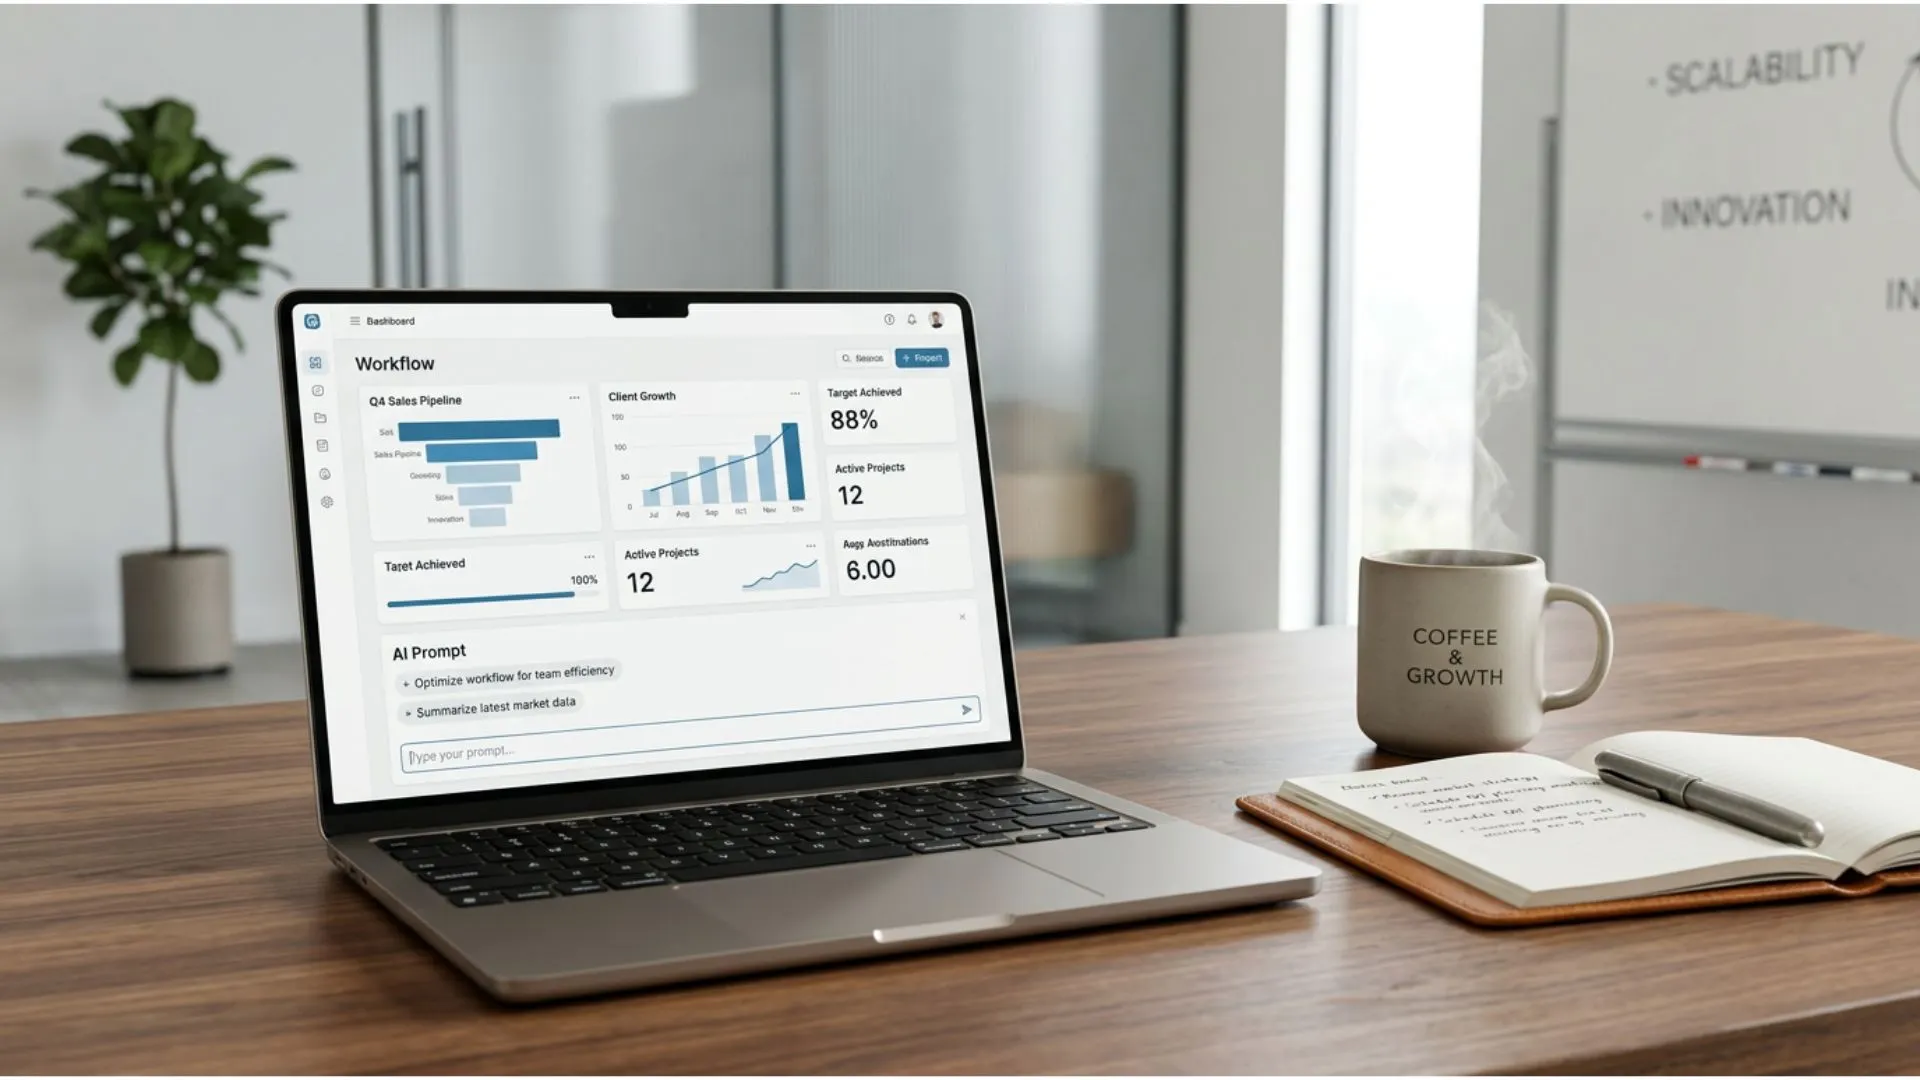
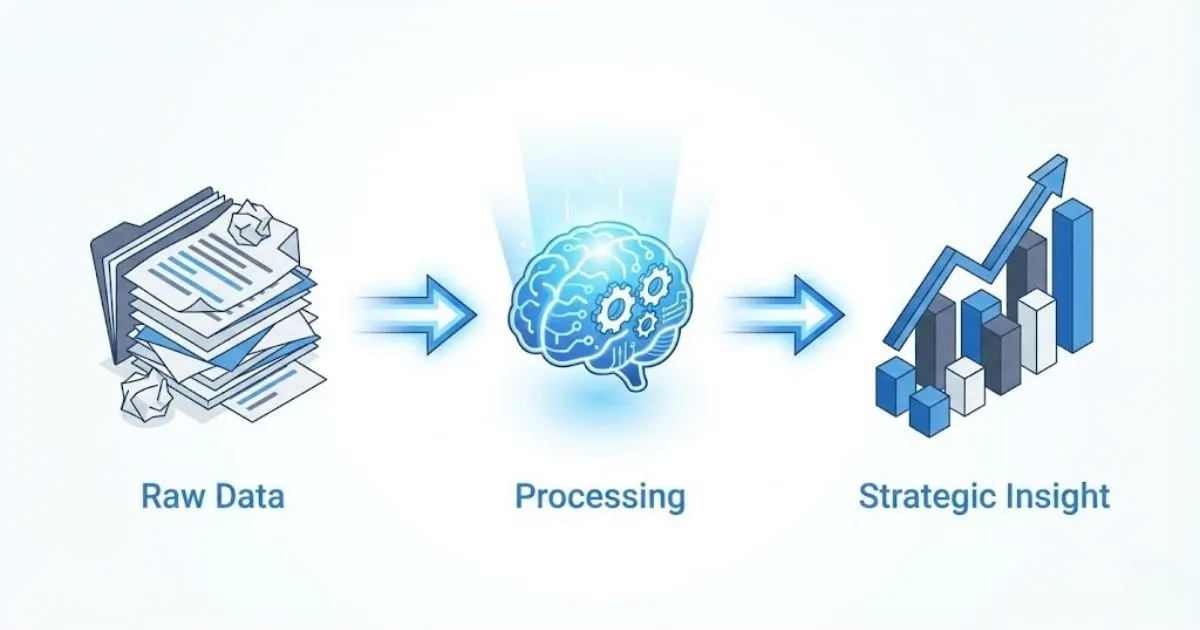
Once your data is clean and sitting in your Google Sheet, it’s time to visualize it. This is where the magic happens—transforming rows of numbers into a dashboard that tells a story at a glance.
Open Looker Studio and create a blank report. Select "Google Sheets" as your data source and connect to the sheet you just prepared.
Now, drag and drop.
- Create a Scorecard for "Total Revenue this Month."
- Create a Time Series Chart to show "Leads Generated" over the last 30 days.
- Create a Pie Chart to breakdown "Revenue by Service Type."
The beauty of this setup is that the dashboard is "live." As long as the data in your Google Sheet is updated (either by you or an automation tool like Zapier), the charts in Looker Studio update automatically. You can bookmark this page and check it every morning with your coffee, giving you an immediate pulse on the business without logging into three different accounts.
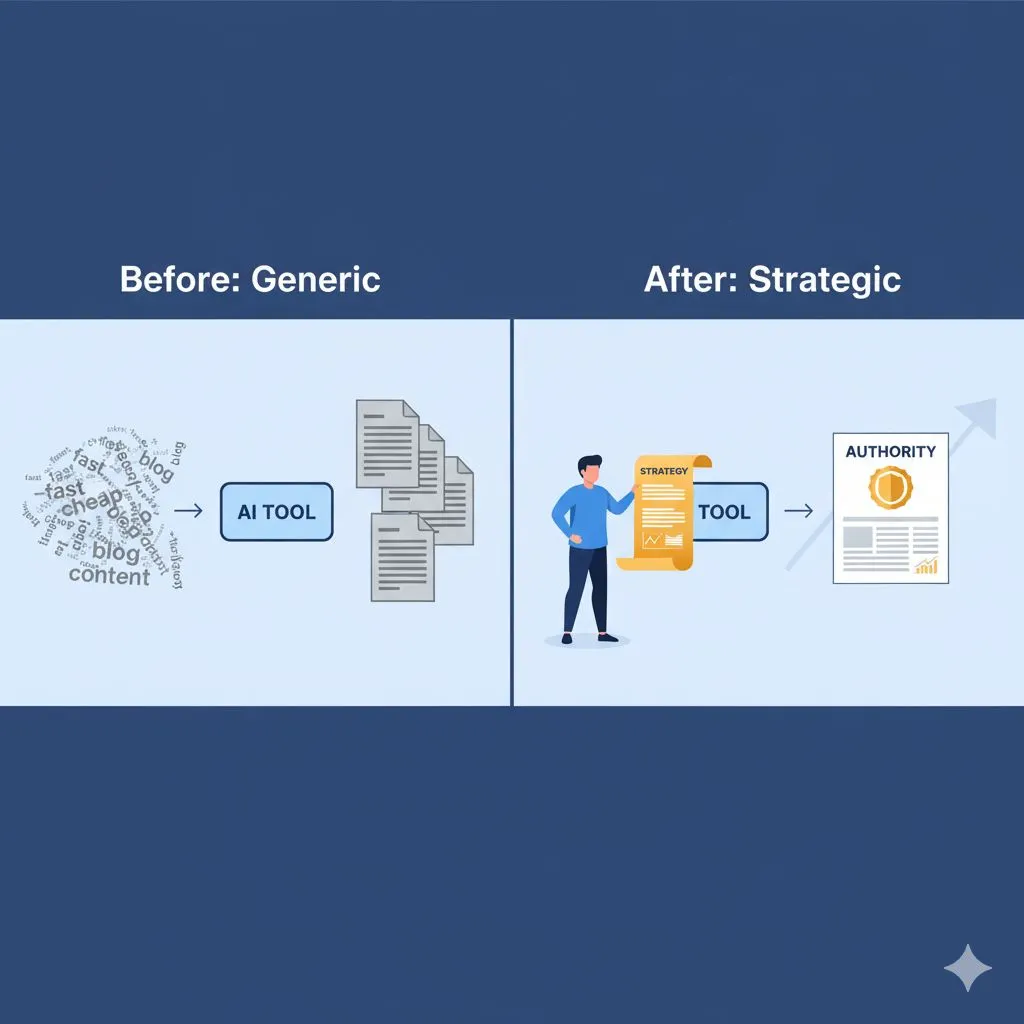
Turning Data into Strategy: The AI Analyst Layer

Visualizing data is only half the battle. By using advanced prompting strategies, you can turn your AI tool into a world-class business consultant that knows your numbers inside and out. A chart showing sales are down is useful, but it doesn't tell you why or what to do next. This is where we integrate strategic ai business tools to move from observation to optimization.
You don't just want to see the data; you want to interrogate it. By using advanced prompting strategies, you can turn your AI tool into a world-class business consultant that knows your numbers inside and out.
Prompting for Insight
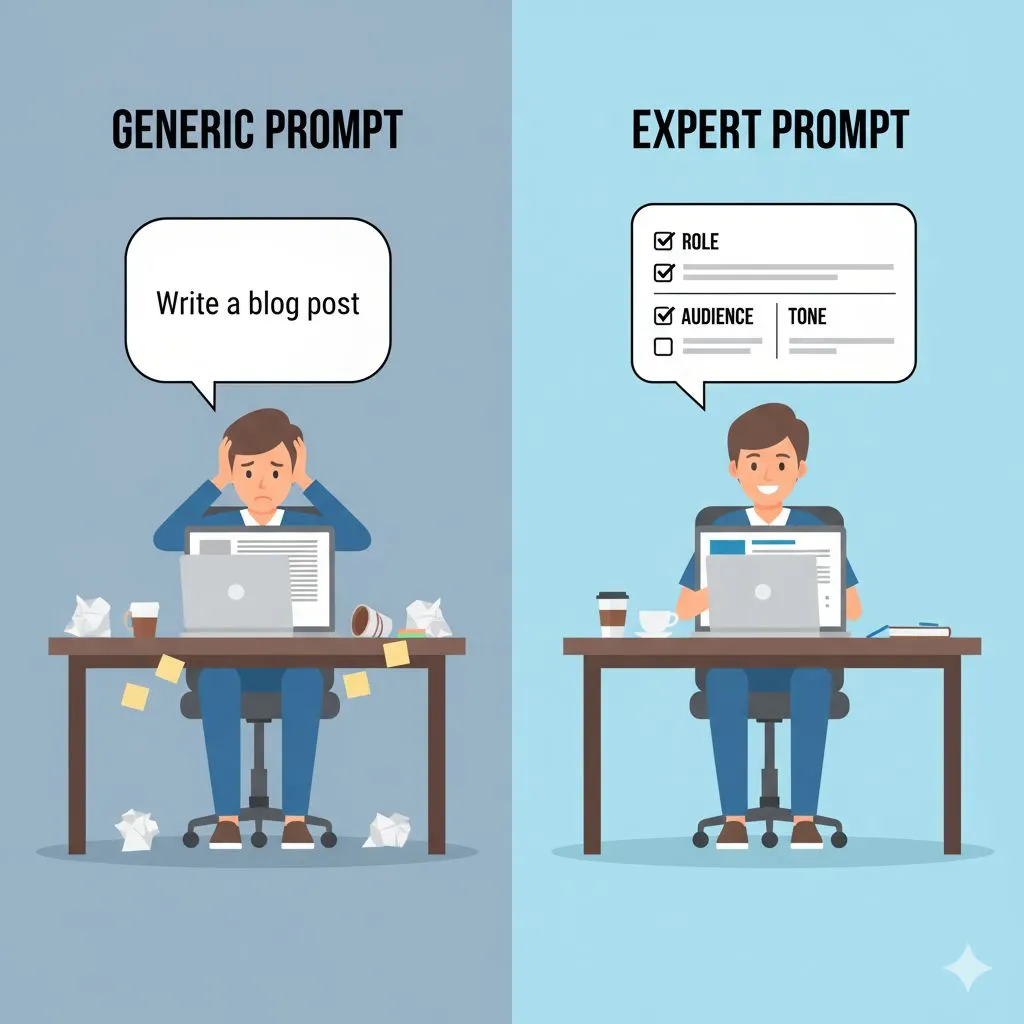
Once a week, take your consolidated data and feed it into your AI model. Use specific, role-based prompts to uncover insights that might be hiding in plain sight.
Example Prompt 1: The Trend Spotter
"Act as a Senior Data Analyst. I am uploading my sales data from the last 12 months. Please analyze this for seasonality trends. Are there specific months where we consistently dip? Based on this data, when should I launch my next marketing campaign to offset slow periods?"
Example Prompt 2: The Profit Optimizer
"Analyze this breakdown of project hours vs. revenue. Which service type has the lowest effective hourly rate? Identify the bottom 20% of projects that are draining resources without providing proportional profit, and suggest a strategy for either repricing or sunsetting these services."
These aren't just questions; they are strategic maneuvers. The AI can process thousands of rows to find correlations—like noticing that clients who buy "Service A" almost never buy "Service B," suggesting you should stop cross-selling to that segment and focus elsewhere.
Scenario Planning
Business is unpredictable, but AI can help you prepare for the unknown. You can use your data to run "What If" simulations.
The "Disaster" Check:
"Based on my current average monthly expenses and revenue trends from the uploaded sheet, simulate a scenario where revenue drops by 30% for the next three months. How does this impact my cash flow runway? Suggest three immediate cost-cutting measures based on my expense categories."
The "Growth" Check:
"If we increase our lead generation by 20% next quarter, assuming our current conversion rate stays the same, what is the projected revenue increase? How many new staff hours would be required to fulfill this demand based on our current hours-per-project average?"
This allows you to make decisions based on data-backed probabilities rather than gut feeling or fear.
For real data benchmarks and ROI projections across industries, explore our AI ROI data for your industry resource hub.
Automated Reporting
Finally, let’s tackle the communication aspect. If you have a small team, stakeholders, or even just for your own accountability, reporting is essential but tedious. You can automate the creation of an "Executive Summary."
After your weekly data analysis, ask the AI to summarize the findings into a digest.
The Prompt:
"Based on the insights we just generated, write a brief, professional Weekly Executive Summary for my team. Highlight the 3 key wins, 2 areas of concern, and the primary focus for next week. Keep the tone encouraging but focused on ROI and efficiency."
You can then copy-paste this into your team Slack channel or Monday morning email. You look like a genius who spent hours analyzing the business, but you actually spent 10 minutes orchestrating the AI.
Want proof this works? See how other businesses scaled delivery with AI in this real-world case study.
Moving From Manual to Automated (Scaling Up)
As you grow, the manual "copy-paste to Google Sheets" step will become a bottleneck. This is a good problem to have—it means you are scaling.
When you reach this point, revisit the Connector tools mentioned earlier (Zapier or Make).
- Trigger: New Order in Shopify.
- Action: Create Row in Google Sheet.
- Action: Send summary to Slack.
By automating the data entry, your dashboard becomes a living, breathing entity that updates in real-time, 24/7. This is the ultimate goal for Alex Rivers: a business that reports on itself, freeing you to focus on high-level strategy and getting your life back.
Conclusion
Building a business dashboard with AI insights is not about adding more tech to your already overflowing plate. It is about removing the blindfold.
For the overworked business owner, the transition from "hustler" to "strategist" requires a shift in how you view your data. It’s not just a byproduct of doing business; it is the map that shows you where the treasure is buried.
By utilizing accessible ai business tools, you can build a system that:
- Centralizes your truth so you stop guessing.
- Visualizes your performance so you can spot trends instantly.
- Analyzes your future so you can make proactive decisions.
You don't need the resources of a Fortune 500 company to compete with them. You just need to work smarter. The tools are there, the data is yours—now it’s time to put them to work.
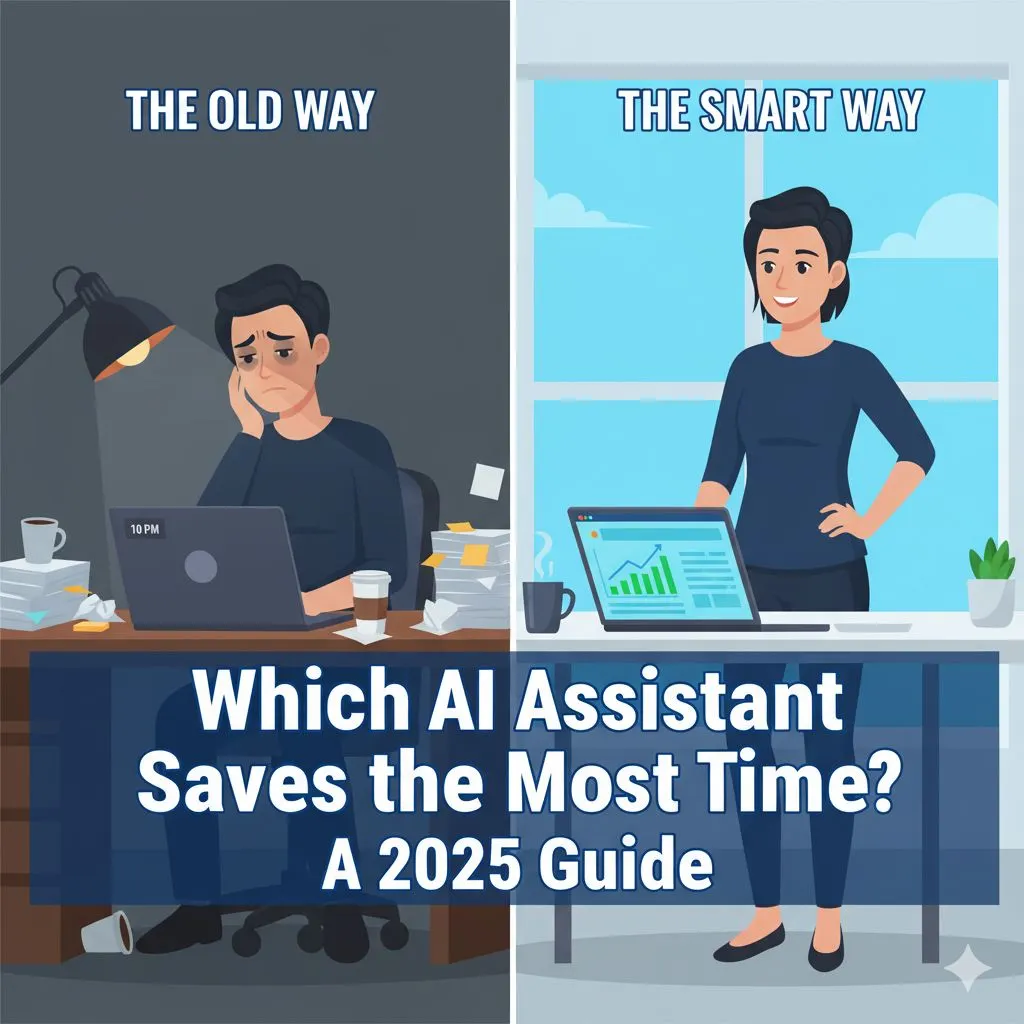
If you are ready to see exactly how much time and money these AI efficiencies can save you, it’s time to look at the hard numbers. Stop wondering if AI is "worth it" and get the proof you need.
Not sure where to start? Get started with our free AI resources — 11 tools to help you experience expert-level AI before you invest.
Ready to implement? Browse all 30 industry-specific prompt packs and see which one fits your business.